Search Knowledge Base
How To Use The Case Work Dashboard
Case Work Dashboard
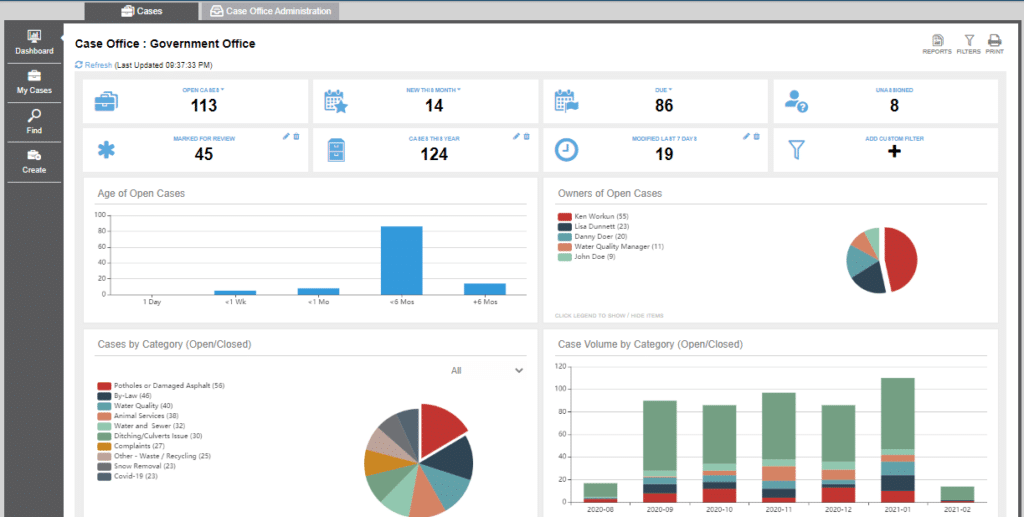
Users with a role of Office Administrator or Office Staff are able to access a dashboard that aggregates and summarizes information for the Case Office as a whole. This is the main landing page of the Case Work application.
This guide provides an orientation to the key features of the dashboard including:
- Filtering the available information to see only the information that interests you.
- Working with the charts that are presented.
- Working with maps.
- Viewing and updating cases.
- Generating reports for the entire dashboard, case list or individual cases.
Filtering the Dashboard
At the top of the dashboard, you will see four pre-configured filters and four custom filters. Clicking any of these will open a list of cases that match the corresponding filter criteria. For example, clicking the filter at the top left of the dashboard (1) opens a list of all the Open Cases in your office. For the pre-configured filters, there are options you can change (2). For example, it is possible to change Open Cases to Closed Cases, or to All Cases.
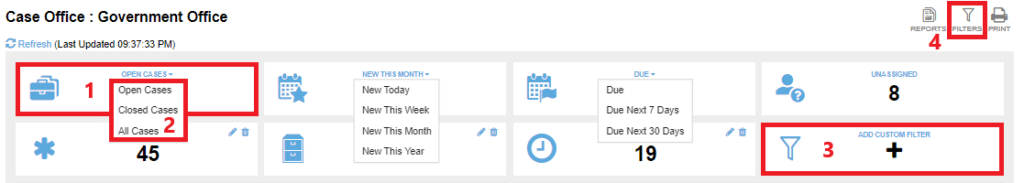
It is also possible to create filters based on criteria of your choice. These are called Custom Filters (3).
You can also filter the entire dashboard’s results for the case categories you are interested in by clicking the filter button on the top-right of the dashboard (4).
Custom Filters
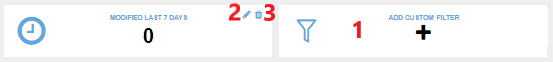
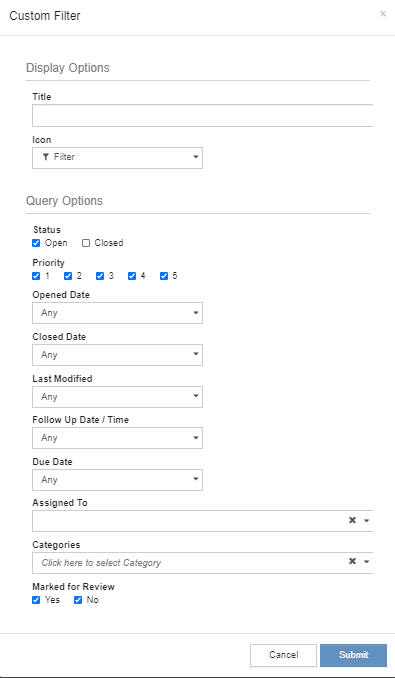
To create a Custom Filter, click on Add Custom Filter (1). The criteria for your custom filter can be configured to suit your needs based on the options in the pop-up shown below. Once you enter the values that you are interested in, clicking Save will ensure that the filter is always available to you.
Editing a Custom Filter is very similar to creating one. To edit a Custom Filter, click on the edit (pencil) icon (2).
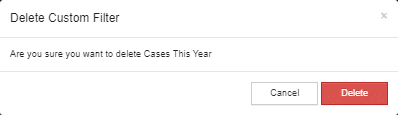
To delete a Custom Filter, select the garbage can icon (3). Then confirm by selecting Delete in the pop-up shown for this purpose.
Working with Charts
The charts in the dashboard provide visualizations for Case Office activity based on:
- Age of all open cases.
- Top owners of all open cases.
- All cases by category, both opened and closed.
- All cases by category by date, both opened and closed.
The last three of these charts can be dynamically modified to add and remove any charted item by clicking on the item in the chart legend. This can be useful when there is a single item that is disproportionately larger than the others. By removing it, the other items’ relative values become clearer. You can also hover over any item in the chart to get additional details or context.
Working with Maps
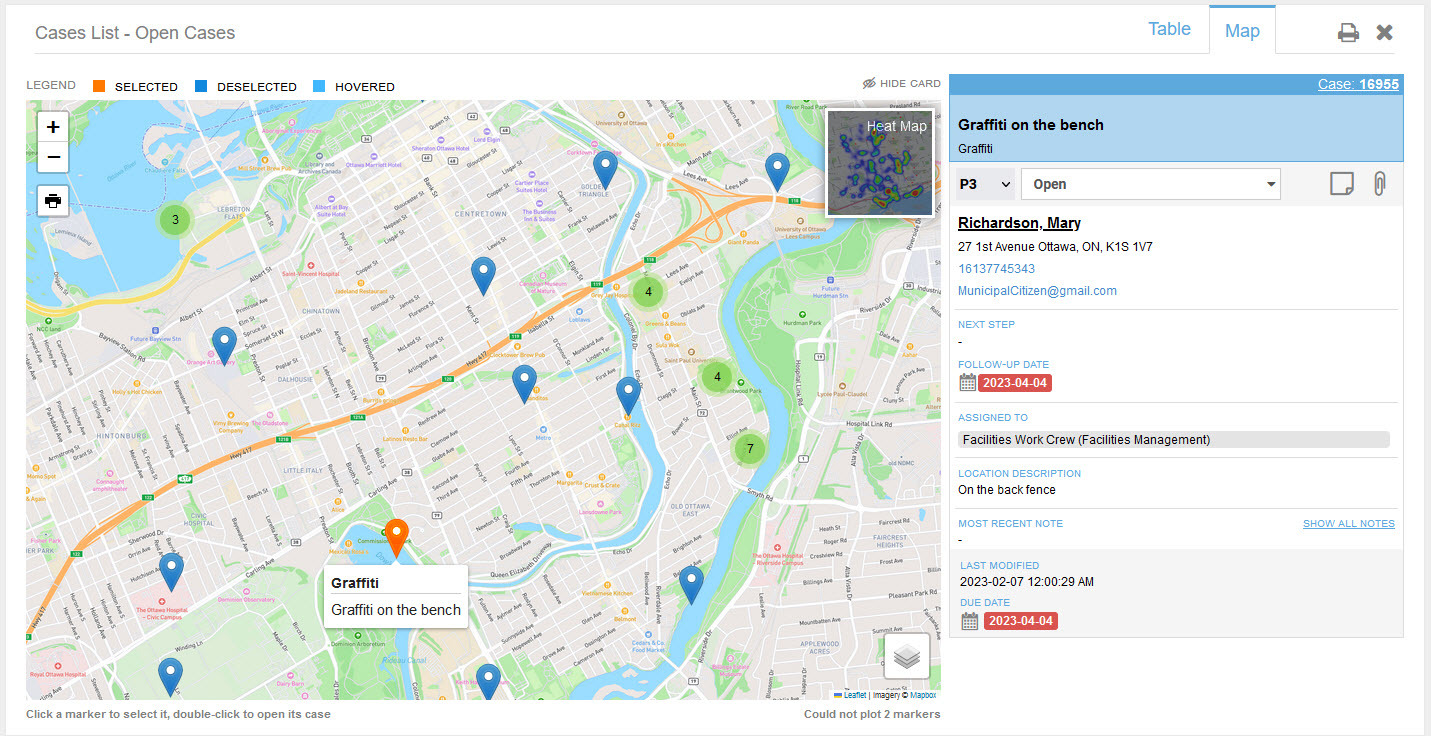
If maps are enabled, you can click the Map tab to view your cases as a Pin Map. The orange pin on the map identifies the precise location of the currently selected case, i.e. the case shown in the adjacent case card, and the blue pins show the locations for all other cases. You can change the case you are currently viewing simply by clicking on a different pin. If a bunch of cases are happening in close proximity, there will be a circle with the number of cases that are in that area. Simply click on a circle to zoom in further on that part of the map, splitting up the cases.
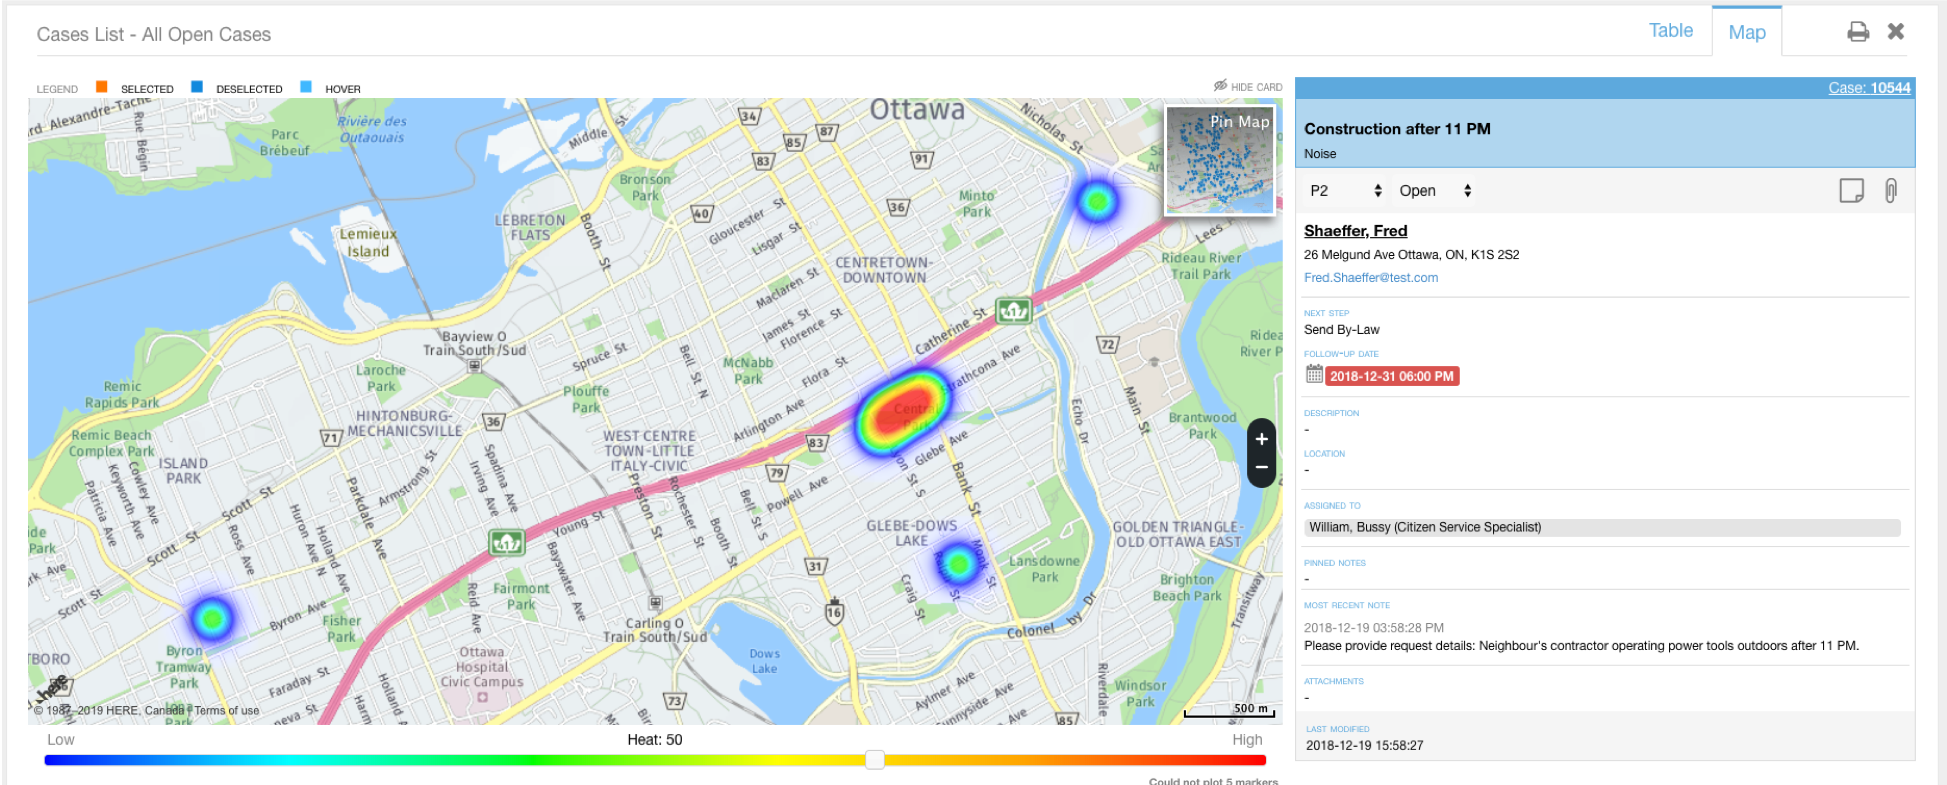
You can also click the ‘Heat Map’ tile to switch to a heat map view of your cases. This is useful for visualizing and identifying areas where the density of cases is more elevated than in other areas, possibly warranting escalation or additional follow-up.
Viewing and Updating Cases
When viewing a filtered list of cases for which you have visibility, you can select an individual case for editing, see How to Update a Case for more details.
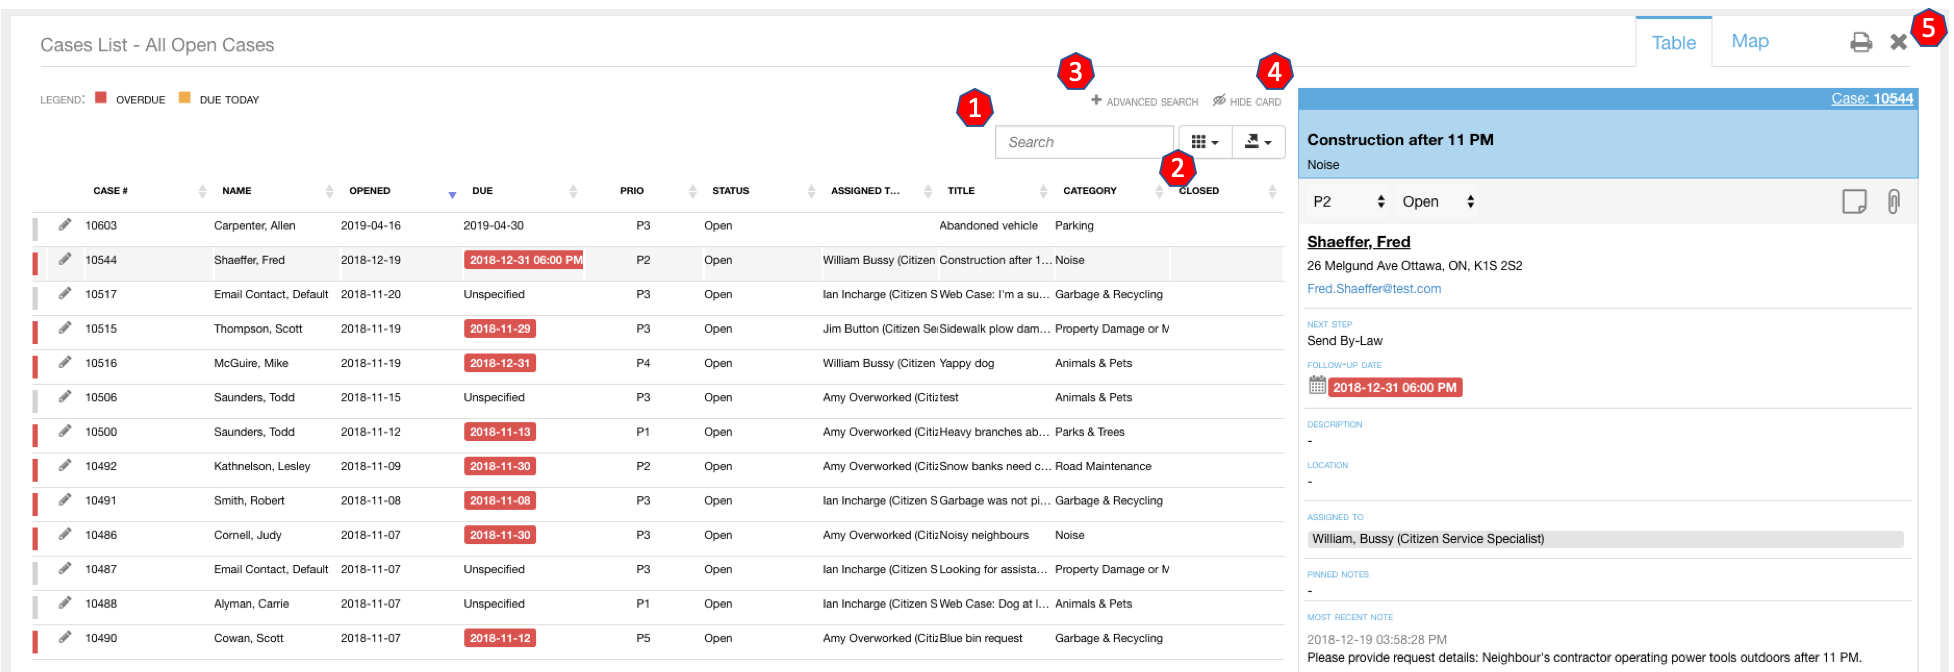
From the Case List, you can also perform a text search on the list to find specific cases (1), choose which columns are shown in the list (2), change the order in which columns are presented, download the list, or launch an Advanced Search (3). Other features include showing or hiding the case card (4), and the ability to minimize the case list at any time so that only the dashboard charts are shown (5).
Reporting from the Dashboard
Four levels of reporting are available within the dashboard.
- Reporting for the entire Case Office.
- PDF reporting for the entire dashboard.
- Reporting for the summary details in the case list.
- PDF reporting with additional details for all cases in the case list.
Case Office Reporting
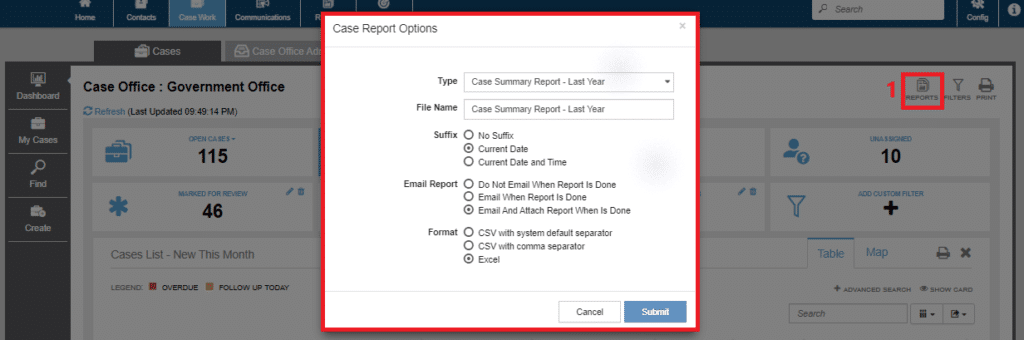
From the Case Work Dashboard, it is possible to Create any Case Work related Report for the entire Case Office. To do so click on the Reports icon (1). A pop-up should appear. In the pop-up enter the desired Report Type, Name, Suffix, Email setting, and Format. For more information about what each of the selections mean visit How To Create Reports.
Print Dashboard
To generate a PDF report for the entire dashboard, select the PRINT icon in the upper right corner of the page.
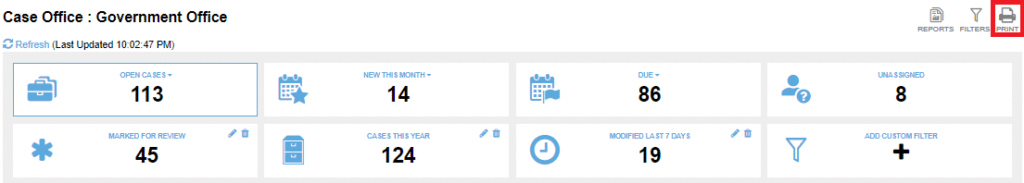
You will be presented with the following reporting options:
- Include Totals – include a snapshot of the quick-filter buttons at the top of the Dashboard.
- Include Summary Table – include a summary of the basic details of all your Cases.
- Include Pin and or Heat Maps – includes maps if you have Maps enabled.
- Include Graphs – include snapshots of all Dashboard charts as they are displayed on the page.
Print Case List
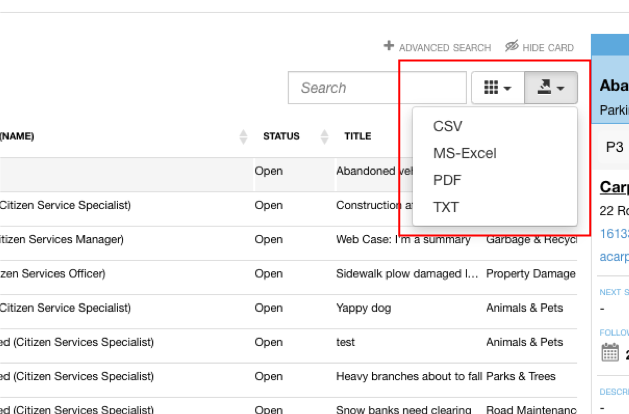
Case list reports can be in CSV, Excel, PDF or TXT format, and can be generated by selecting the desired format in the upper right corner of the case list itself.
Print Case Summary
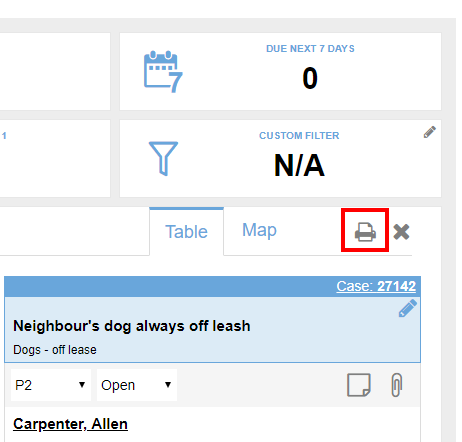
To generate a PDF report for summarizing the listed cases, select the print icon in the upper right corner of the case list pane.
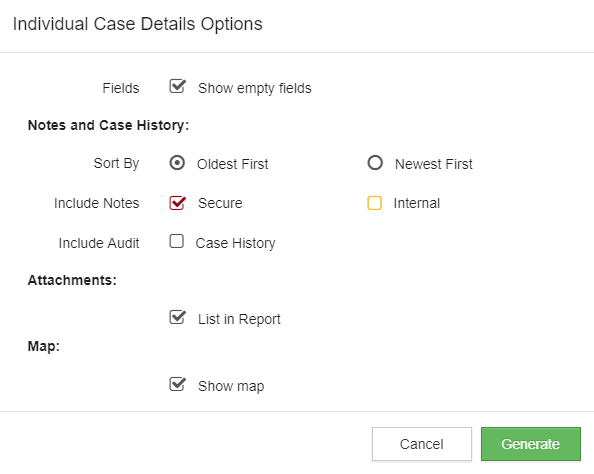
You will be prompted for a number of optional settings related to the case summary report:
- Show empty fields – if you uncheck this option, your report won’t include any fields that have been left blank.
- Notes and Case History – lets you choose whether to include secure and/or internal notes as well as whether to include the Case History.
- Attachments – gives you the option to include a list of attachment information at the end of each summarized case.
- Show Map – determines whether the report includes maps or not.
My Cases
My Cases is where you can easily view and manage the cases that have been specifically assigned to you. Think of this as a personal dashboard that offers similar capabilities to the Case Office Dashboard, and that is filtered by default to the cases you need to pay the most attention to personally. The information that follows summarizes the features in My Cases, however additional detail can be obtained if needed from the Case Office Dashboard descriptions above.
My Cases is accessible from the My Cases option within the Case Work application, or directly from the home page using the button provided.
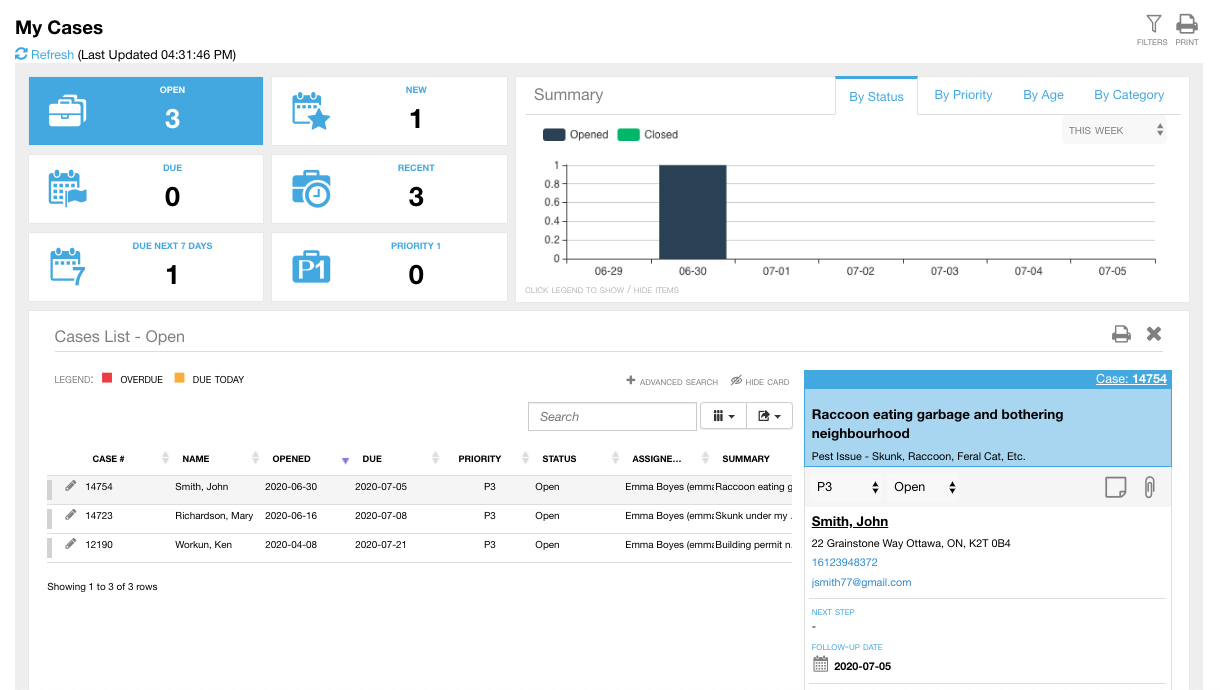
There are six quick-filter buttons in My Cases, each of which indicate the number of cases matching the corresponding filter criteria. Unlike the Case Office dashboard, there is no custom filter. Clicking any one of these buttons expands a list of cases that match the specified criteria.
My Cases List
For the case list, the features and behaviour are very similar to what has been described above for the Case Office dashboard, i.e. you can edit a case, perform a text search on the list to find specific cases , choose which columns are shown in the list, change the order in which columns are presented, download the list, or launch an Advanced Search. You can also show or hide the case card or minimize the case list at any time.
My Cases Charts
Summary charts in My Cases provide the following visualizations of your assigned case workload. Up to 3 months of data can be shown.
- Number of cases by status (open/closed) and date.
- Number of cases by priority and date.
- Total cases by time since they were opened.
- Number of cases by category and date.
Note: The summary charts show all your cases regardless of the quick-filter button chosen.
My Cases Maps
As is described above for the Case Office dashboard, My Cases offers equivalent pin map and heat map capabilities, except only for the cases to which you have been assigned.
Reporting from My Cases
Reporting for My Cases is identical to Reporting from the Case Office Dashboard described at the beginning of this guide, i.e. three levels of reporting are available.
- PDF reporting for the entire My Cases dashboard.
- Reporting for the summary details in the case list.
- PDF reporting with additional details for all cases in the case list.